Why, What, and How?
Why
When you start running GPU workloads at home — whether for LLM inference, AI gateways, or robotics — you quickly realize you’ve got visibility gaps. Monitoring GPU utilization is easy. Understanding why performance drops under load, or when Thunderbolt/PCIe connections start throttling, is a different story.
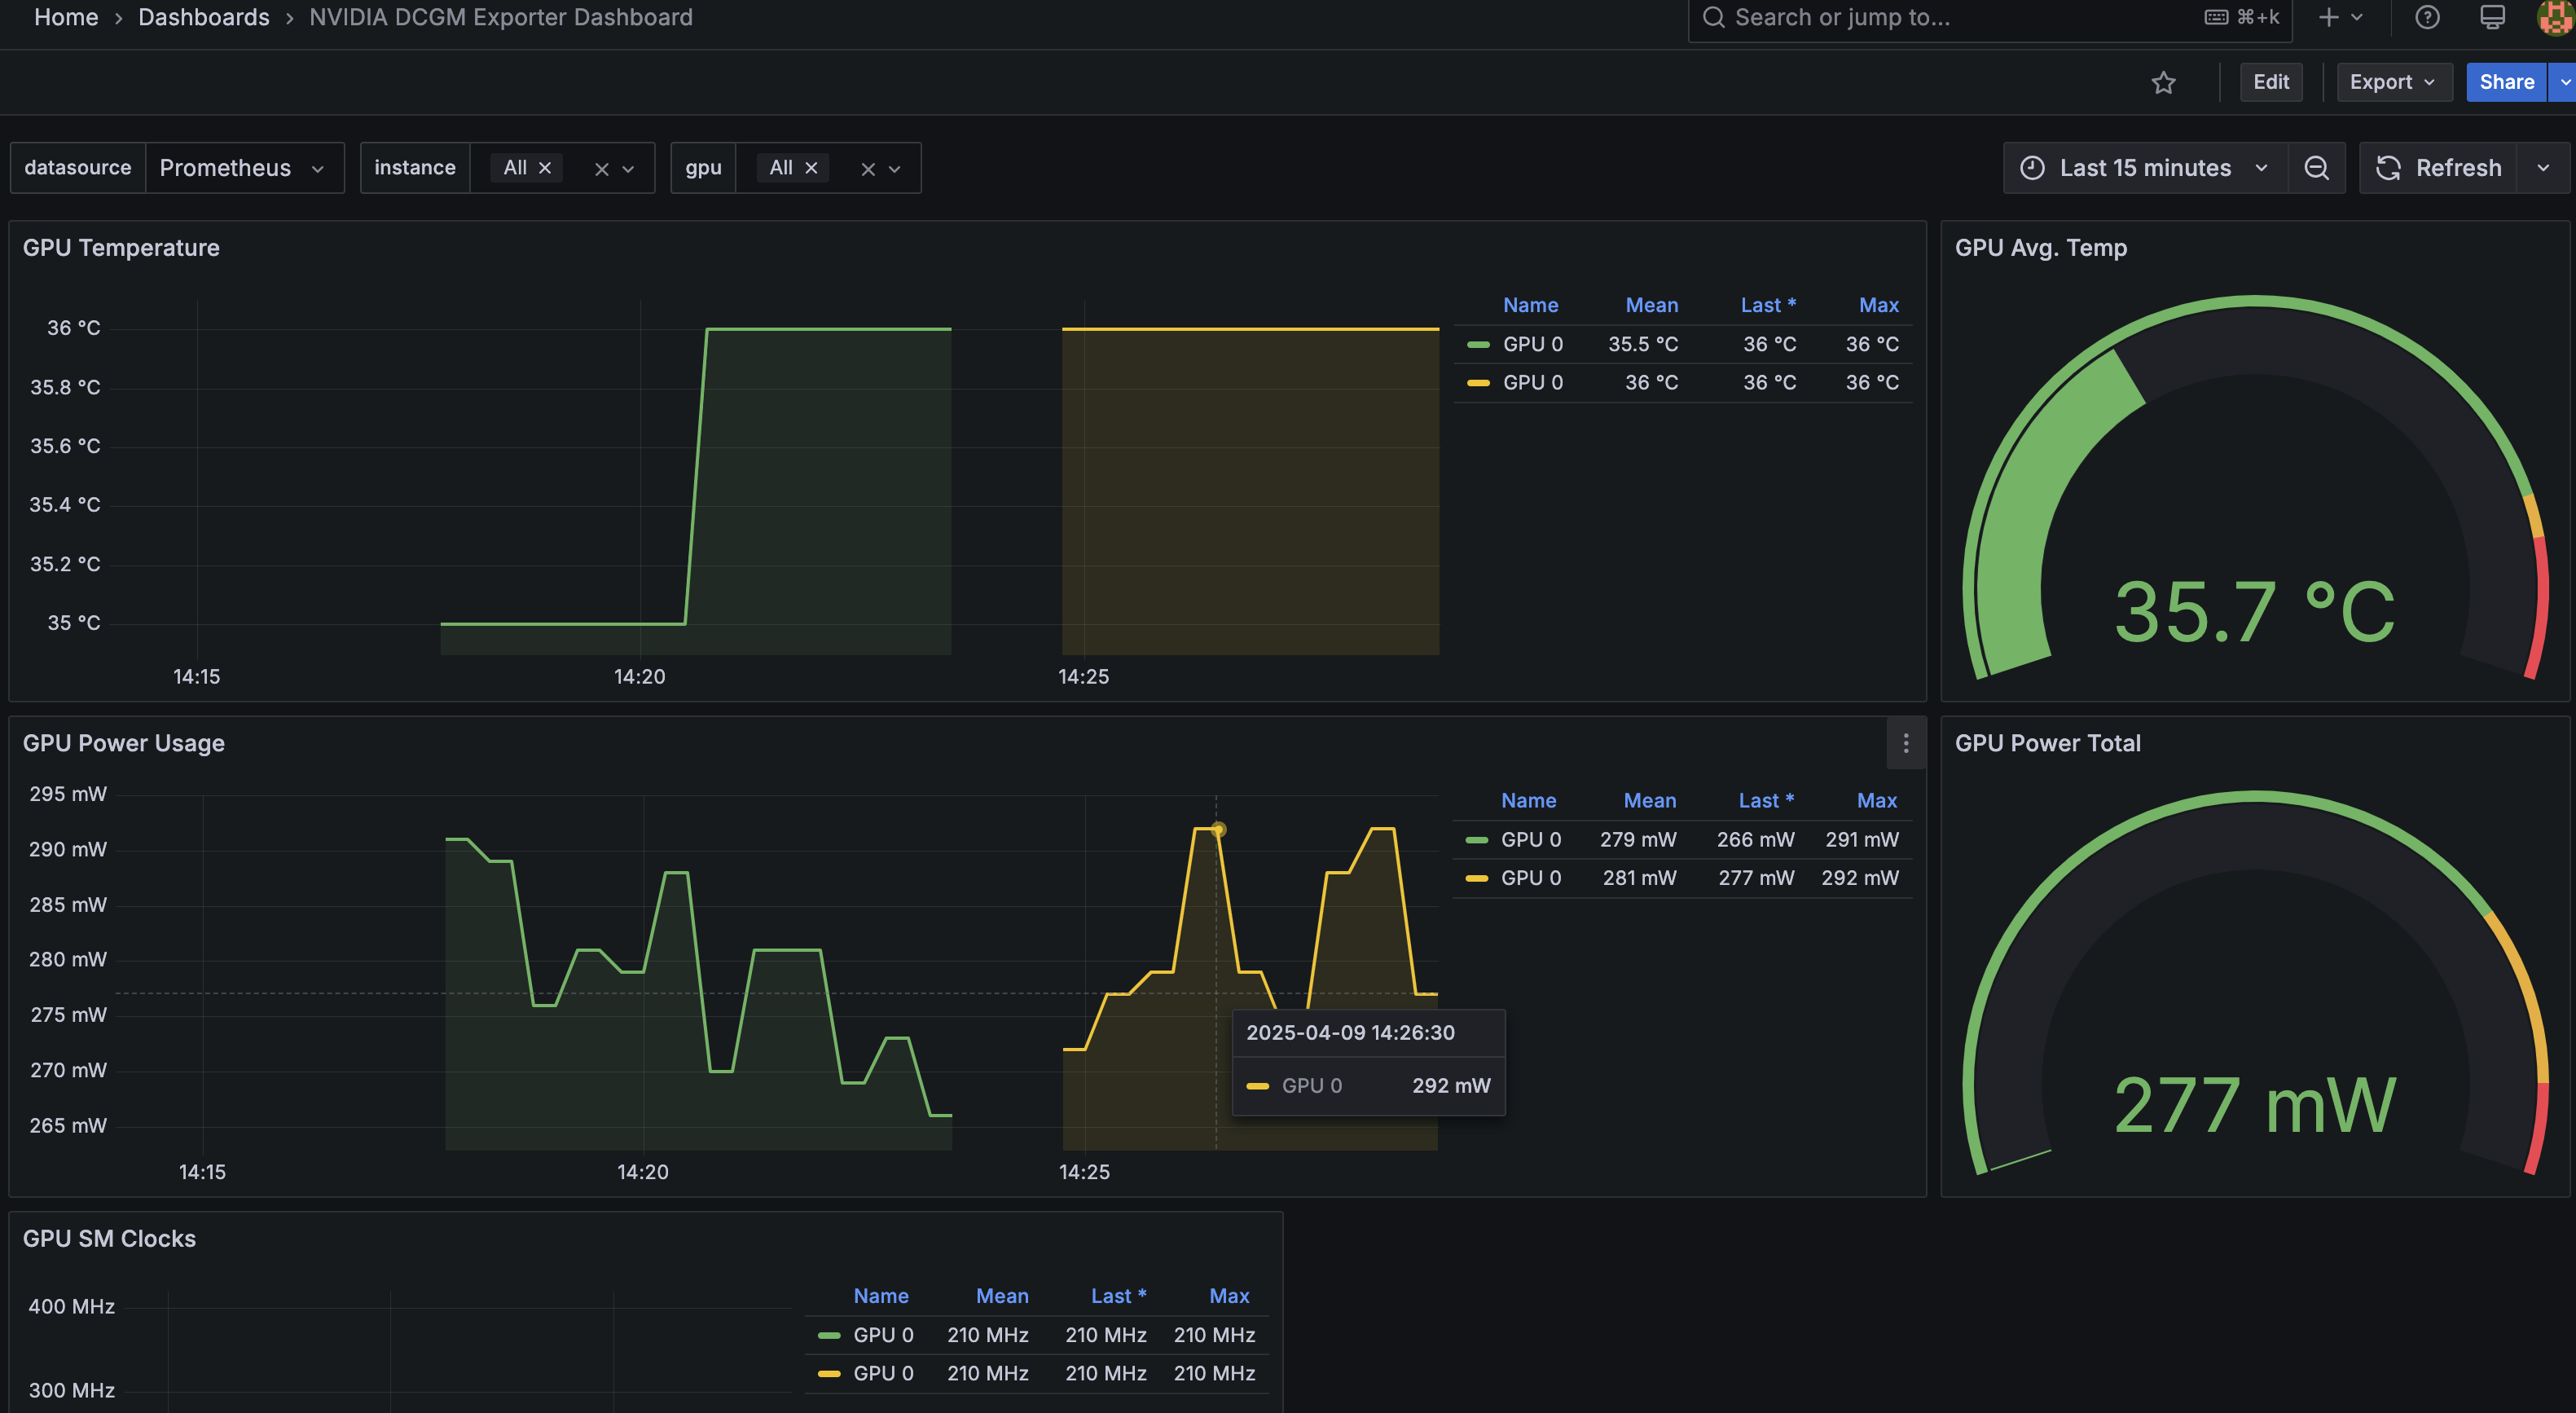
Below is the layout of a NVIDIA 4070 Super connected to a kubernetes node that is virtualized on proxmox. The gpu is connected via thunderbolt and set on passthrough mode so it can be utilized by the virtualized machine mlops-worker-00. We are already using dcgm-exporter but it does not give us the metrics we need to build a thorough visualization that portrays the understanding of this setup current state in real time.
┌─────────────────────┐           ┌────────────────────────────┐
│  Proxmox Host       │           │  Kubernetes Node (Talos)   │
│  ┌───────────────┐  │           │  ┌──────────────────────┐  │
│  │ eBPF Agent    │◀─┼── bridge ─┼─▶│ DaemonSet: eBPF      │  │
│  │ (systemd      │  │  vmbr0    │  │ gpu + net probes     │  │
│  │  container)   │  │           │  └──────────────────────┘  │
│  └───────────────┘  │           │    ┌──────────────┐        │
│                     │           │    │ Prometheus   │        │
│                     │           │    │ node_exporter│        │
│                     │           │    └──────────────┘        │
│                     │           │         ▲                  │
│                     │ Thunderbolt│ Scrape │                  │
│                     │   3/4      │        │                  │
│                     │           │  ┌─────┴─────┐             │
│                     │           │  │ Grafana    │            │
│                     │           │  └────────────┘            │
└─────────────────────┘           └────────────────────────────┘
What
eBPF (extended Berkeley Packet Filter) lets you safely run custom programs in the Linux kernel without kernel modules or intrusive instrumentation. Think of it as a programmable microscope for the OS, giving you real-time insights into scheduling, I/O, syscalls, and network flows. On Talos (an immutable OS), you can’t install tools like bcc or perf. Instead, you deploy eBPF agents as privileged DaemonSets in Kubernetes.
That pattern fits perfectly for GPU nodes, where you want to correlate kernel-level metrics with DCGM GPU telemetry — all without breaking Talos immutability.
How?
Overview
To provide visibility into the unknown, we will use a combination of open source tooling and personal tooling and discovery of what type of metrics we can collect and aggregate for display.
- Cilium/Hubble → Network QoS and RTT
- eBPF Agent → Kernel & scheduling latency
- DCGM Exporter → GPU utilization & PCIe throughput
- Parca → CPU flamegraphs
┌──────────────────────────────┐
│     Talos Linux Worker       │
│ ┌──────────────────────────┐ │
│ │ NVIDIA GPU (Thunderbolt) │ │
│ └──────────────────────────┘ │
│  ↑ PCIe/DMA  ↑ Network ↓    │
│ ┌──────────────────────────┐ │
│ │ eBPF Agent DaemonSet     │───► Prometheus (TCP RTT, IRQ latency)
│ └──────────────────────────┘ │
│ ┌──────────────────────────┐ │
│ │ DCGM Exporter DaemonSet  │───► Prometheus (GPU util, PCIe TX/RX)
│ └──────────────────────────┘ │
│ ┌──────────────────────────┐ │
│ │ Parca Agent (eBPF CO-RE) │───► Parca Server (CPU flamegraphs)
│ └──────────────────────────┘ │
└──────────────────────────────┘
Details
One example of using ebpf to derive metrics for monitoring gpu performance is the network Qos (quality of service) over gpu utilized routes in the network. I have set cilium to enable Bottleneck Bandwidth and Round-trip propagation time which can durastically improve throughput and latency.
bandwidthManager:
  enabled: true
  bbr: true
Then, you can use the annotations below to define your ingress / egress bandwidth limits so pods do not exceed 500 Mbps in either direction.
metadata:
  annotations:
    kubernetes.io/egress-bandwidth: "500M"
    kubernetes.io/ingress-bandwidth: "500M"
How do you provide visibility into this? I am hoping to capture and utilize the following metrics
ebpf_tc_bytes_totalebpf_tc_dropped_packets_totalebpf_tcp_rtt_microseconds_sumebpf_tcp_retransmissions_totalebpf_sched_latency_microseconds_sum
Which would bundle up to the following metric queries in grafana for display.
# Latency improvement under BBR
rate(ebpf_tcp_rtt_microseconds_sum[1m]) by (pod)

# Traffic shaping validation
rate(ebpf_tc_bytes_total[1m]) by (pod)
If BandwidthManager and BBR are working correctly, RTT variance (jitter) will drop, retransmits will fall near zero, and aggregate throughput will stabilize at ~500 Mbps per pod (or whatever you’ve set).